Helping Things Connected programme reach start-ups working in IoT sector, so that they can enrol in the programme and benefit from onsite mentoring
-
Background
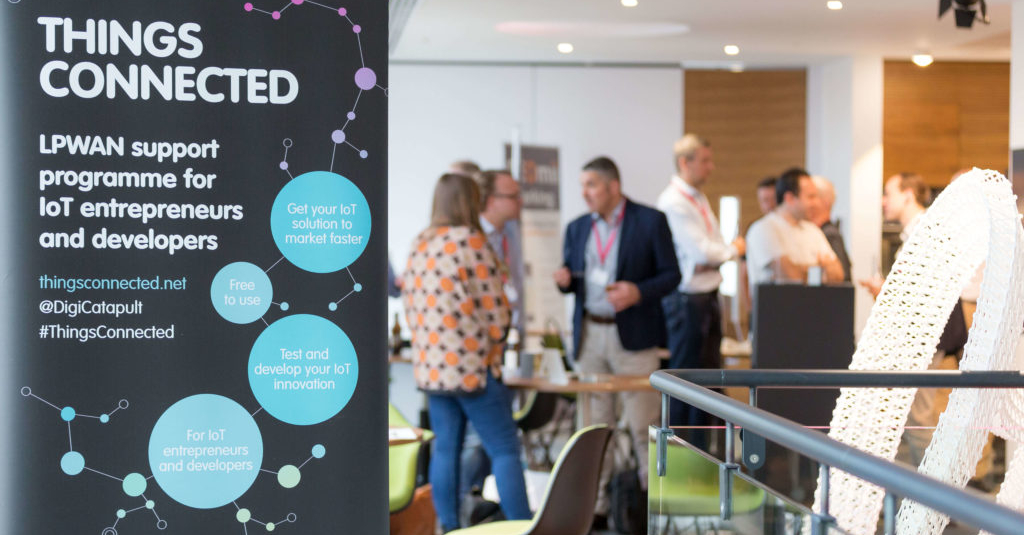
Things Connected is a programme run by Digital Catapult to help start-ups that use Internet-of-Things (IoT) technology to make innovative products or services.
Usually many IOT start-ups are born due to a need the founder faced personally and he/she are learning about IOT on the job. Things Connected programme encourages good ideas and help these founder hone the technical skills and give exposure on how to incorporate better user experience in their prodcut so they can pitch for investment. When the start-ups are in the programme they are given access to the Things Connected dashboard which helps them to connect and monitor sensors to the low powered network, which helps in prototyping ideas and test assumptions. -
-
My role
I was the lead designer on this project. My role was to find research insights and design the whole experience from users point of view keeping in mind business goals. This was a 5 months project and my team consisted of 2 developers and a project manager
Impact
- 1. After the redesign of the website, the number of active users has doubled.
- 2. More positive feedback of the onsite programme regarding connecting and prototyping devices
- 3. 33% increase in number of applications for the programmes across UK
Problem
- 1. The users were sending enquiries about past programmes run by Things Connected thinking that they were the current/running programmes while the open call for new programmes was not getting enough traction.
- 2. The London centre had the highest amount of enquiries while the other centres received a very low level of interest.
- 3. Sigfox, another new low powered networking technology, was being introduced in the website and dashboard. Sigfox works differently than the existing LoRaWAN™ technology.
- 4. Internet of Things (IoT) is a new field and it is characterized by a largely fragmented ecosystem. It is important to explain to the users why and how Things Connected programme is beneficial to them and why they should invest their time in it.
Solution
-
Website redesign
A website that showcases all the current and past programmes of Things Connected based on locations. A clear open call section for new programmes. A section where past participants share their journey from product to investment. Showcasing the two technologies and their strengths with a support/help section for each technology. -
Dashboard redesign
A dashboard which has a step by step guide for connecting various sensors to two different technologies (LoRaWAN™ and Sigfox). It also provides resources and templates introduced in the programme and helps IoT enthusiasts to connect with each other.
-
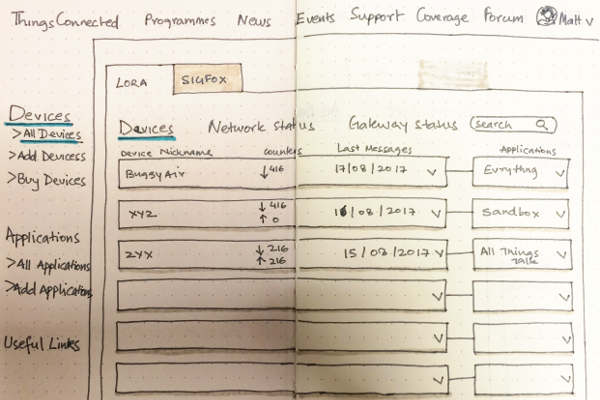
User Research
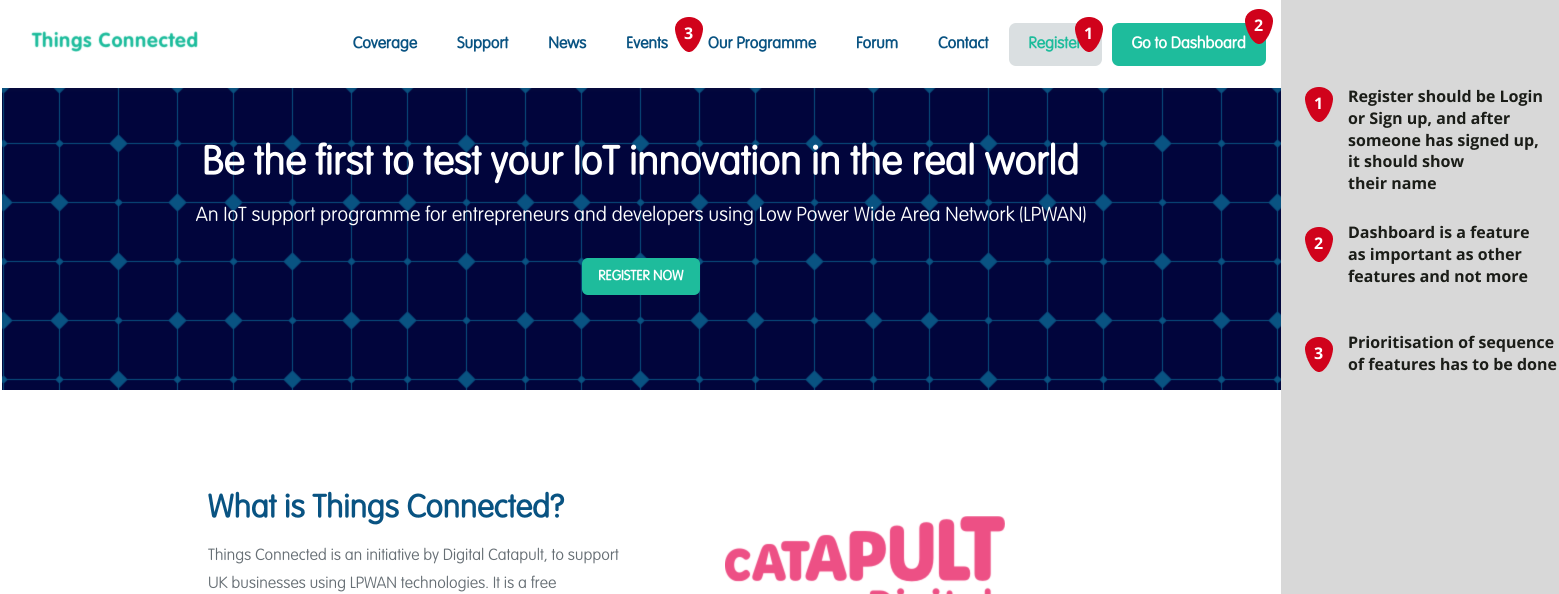
I began the project with a heuristic analysis of the website and dashboard to understand what was working and what needed attention, including how the categories were sorted. There were a lot of issues about how the programmes were displayed and how their locations were mentioned.
-
-
The project consisted of two parts, the website, open to all, and a dashboard, accessible after registering to the Thing Connected programme.
I kicked off the project with broad research covering both the website and dashboard. After understanding the problems and opportunities for the users, I applied the research to improve the website and the dashboard.
I started with interviewing the start-ups in two categories: the ones that had applied for the programmes and the ones that had already completed the programmes. I interviewed five participants from each category.
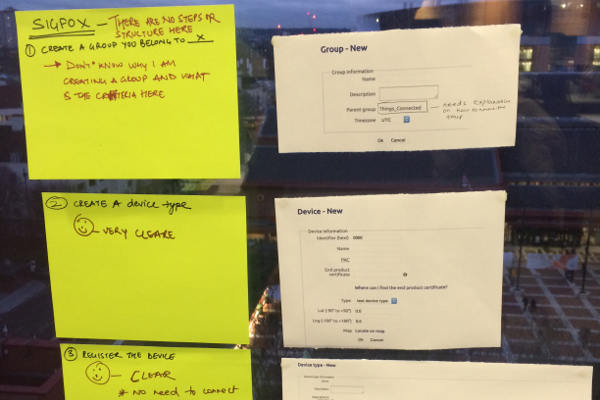
The interview session was divided into two parts. The first part, a contextual enquiry to know better the role and job of the users. In the second part, I questioned them about the existing website and dashboard while the participants were using them. The point of this division was to understand the user needs beyond the existing solutions, and if they could be met through the website and the dashboard. At the same time, I also wanted to understand what was currently working and what could be improved.
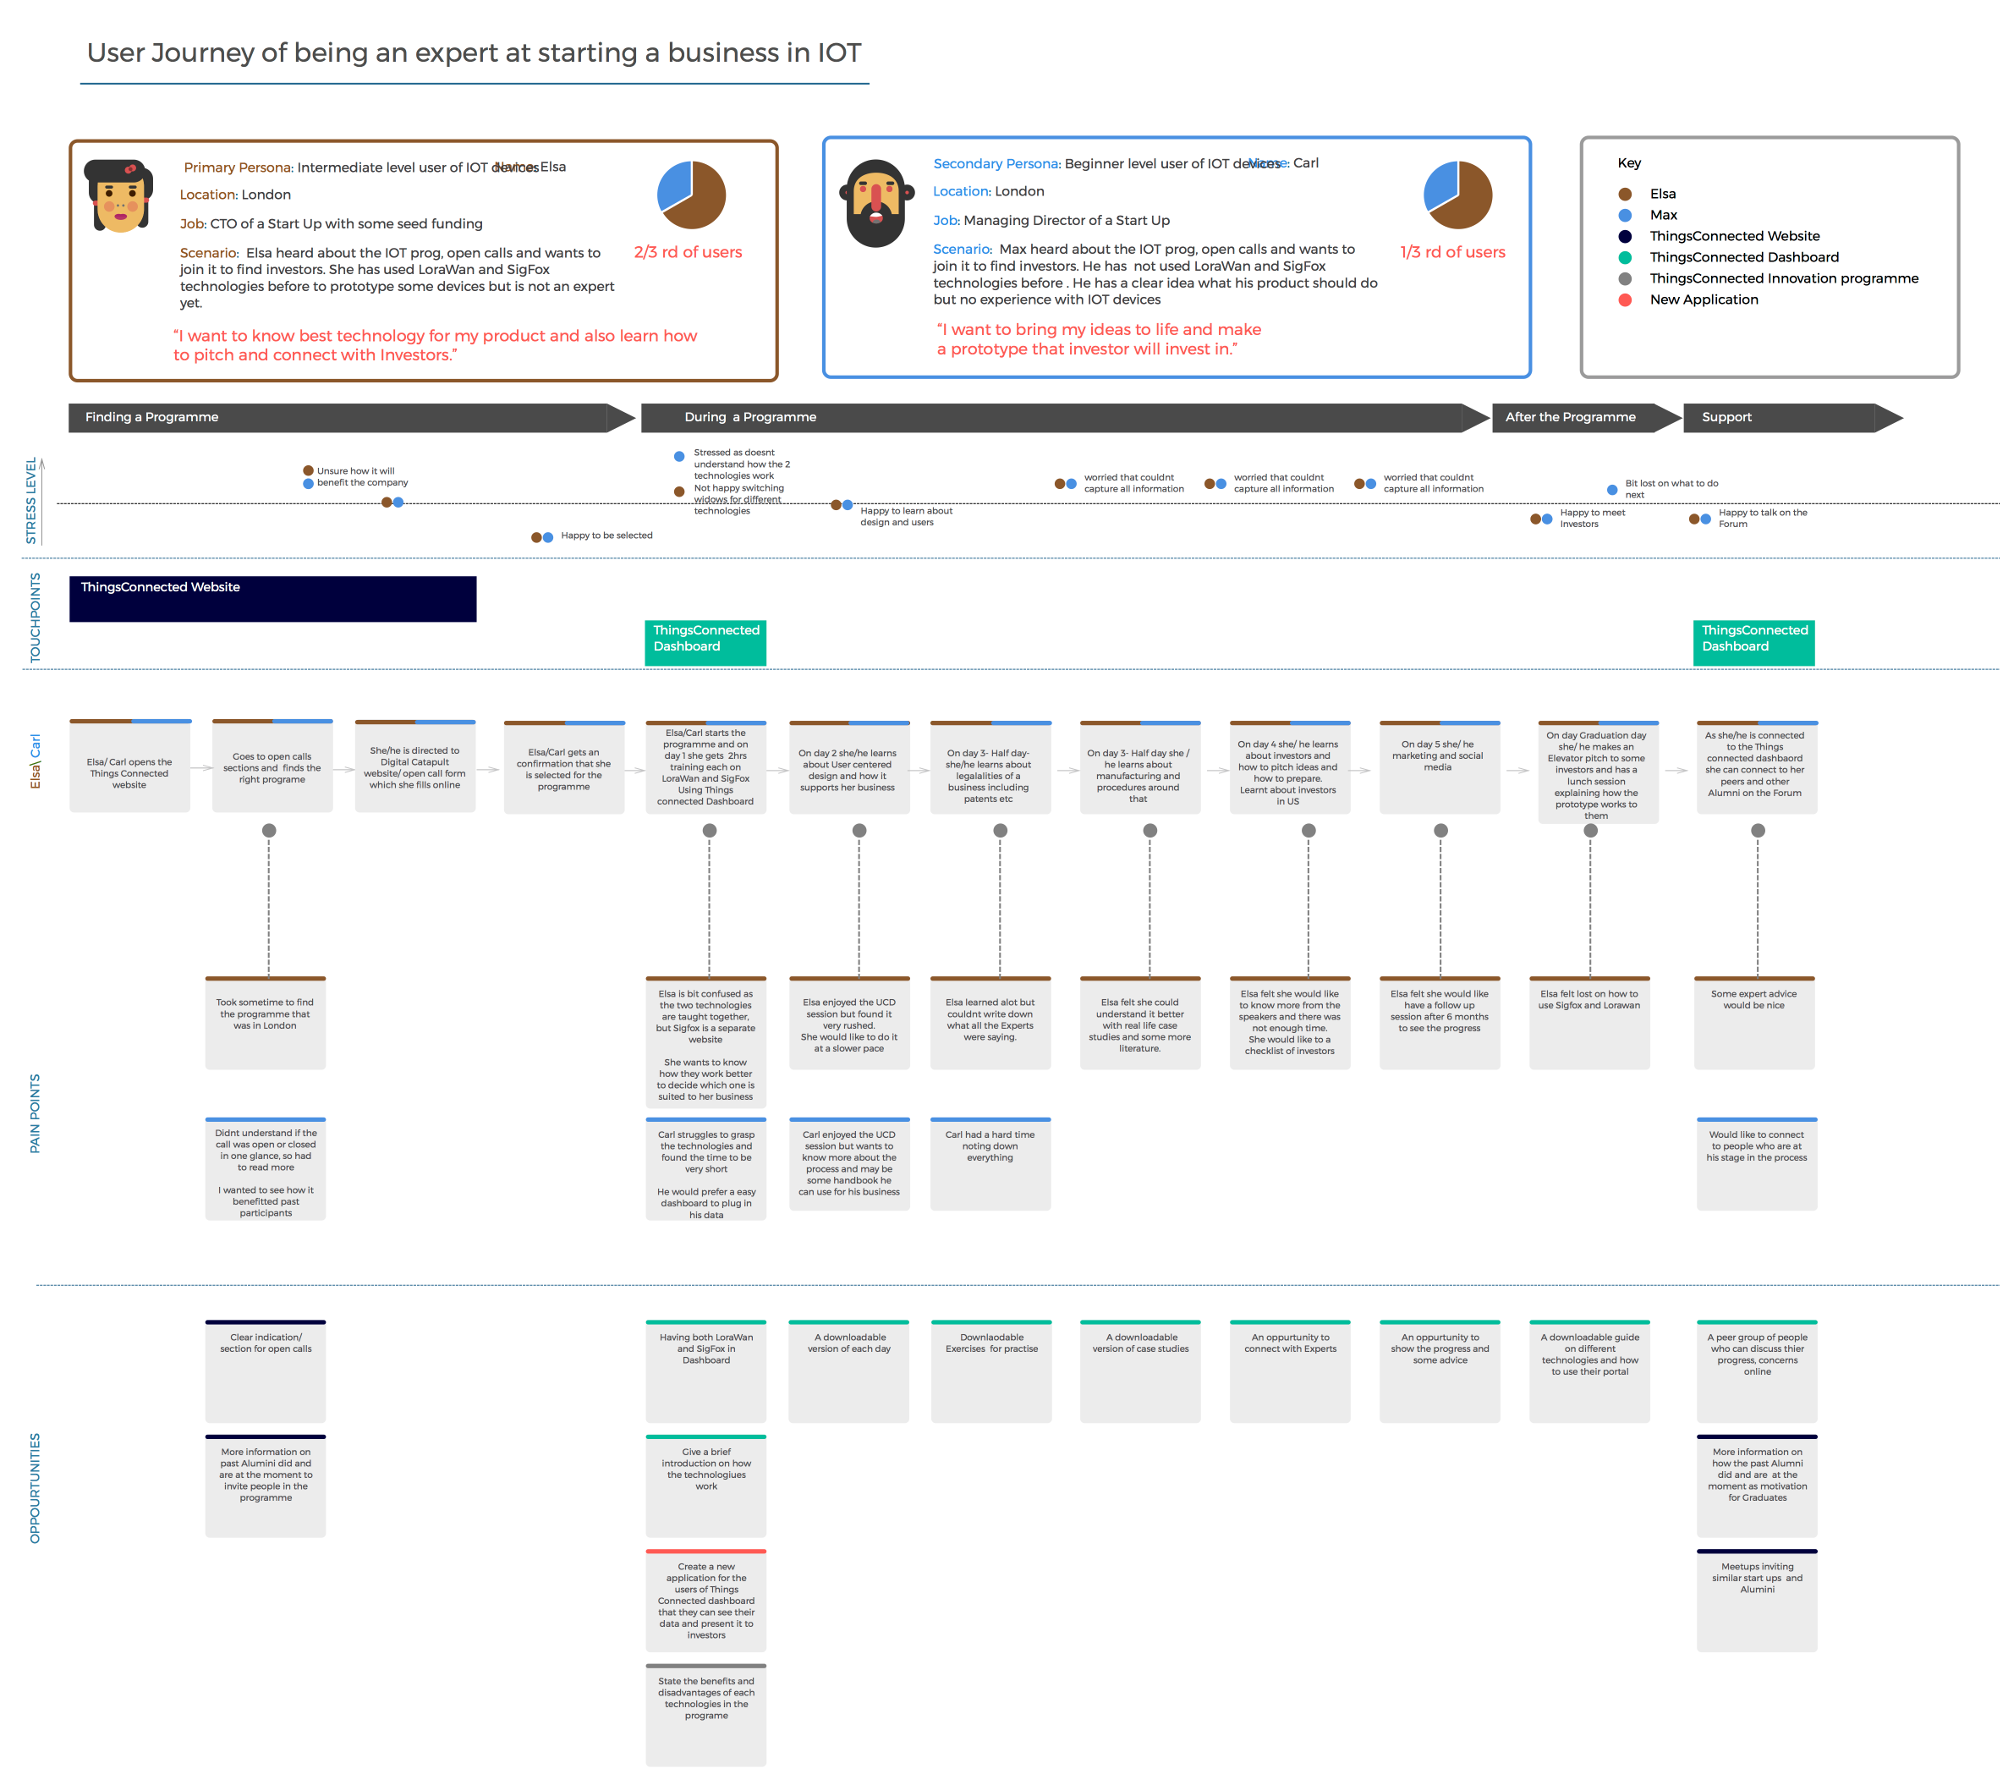
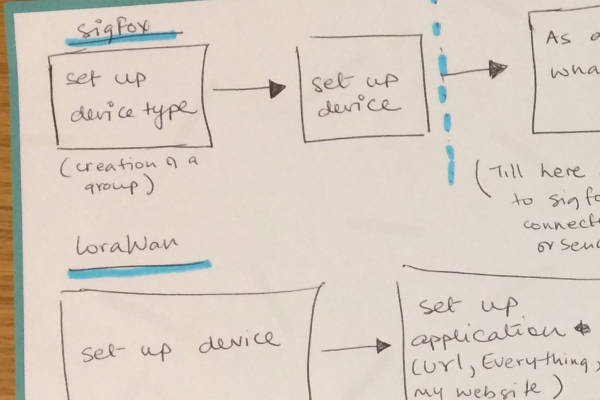
I created a user journey based on those findings which helped to understand the problem and opportunities in a specific area.
The main problems were:- 1. No clarity on the status of the programme: running, terminated or open call
- 2. No clarity on the location of the programme
- 3. A very confusing way of adding devices in the current dashboard
- 4. No resources available after the programme/workshop ends
- 5. Presenting data from the devices in a useful manner so that the start-up could present it to the investors
-
Technical research
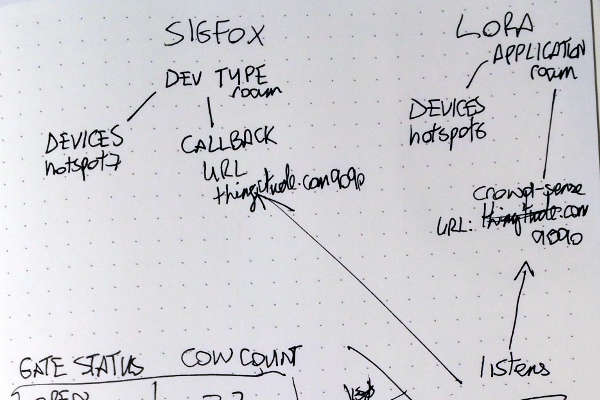
After the user research and creating of user journey, I studied how LoRaWAN™ and Sigfox worked and know their similarities and differences.
For this part of the project, I set up several sessions with the IoT technologists to understand what part and details of the technology should have been exposed to the user. The goal of these sessions was to create a smooth and easy experience for the first-time users and also for the returning users.
LoRaWAN™ is an open source technology and Sigfox is closed.
It was interesting to compare how their existing dashboards were and how they would be presented in the Things Connected dashboard. For this, I studied how they were already working in their current implementations. -
-
To get some insight into how first-time users use sensors and to better understand how sensors are connected to these low powered technology, I build a small prototype. I connected an LED to a Potentiometer. Rotating the handle of the potentiometer the brightness of the LED increased or decreased.
Doing it by myself, I really understood what were some of the weaknesses in technology specially around copywriting which was missed in the interviews as most of the participants has used the dashboards few times and had failed to remember the exact moment in the use of previous dashboard when they had any difficulty. -
Prioritisation and ideation
From the research, I could identify a lot of areas that could be improved and as a team we decided to prioritise what to focus on based on the constraints of time and budget.
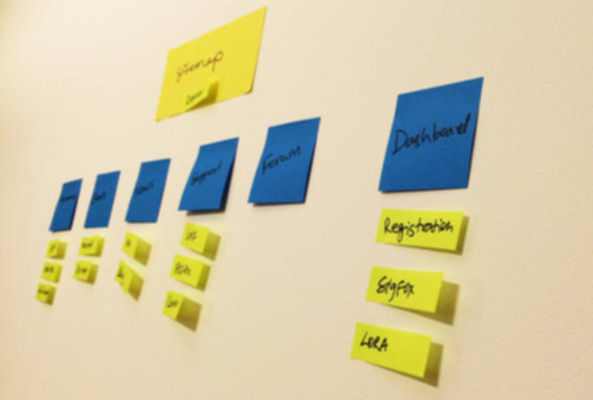
Feature prioritising helped us decide the MVP for this phase. During phase 1 the MVP was included only for development. This also helped in planning phase 2 and decide what would be built during that time. After the feature prioritising I created a site map with MVP. -
-
Co-creation workshop
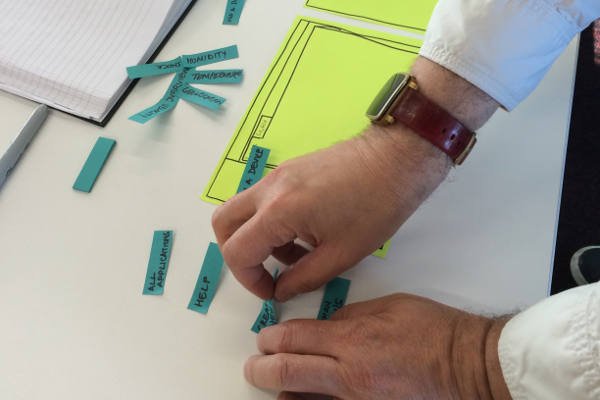
I conducted a co-creation workshop with users and the IoT technologist separately. It was very insightful to see how the users understand the two technologies and how they comprehend the navigation and features.
The session with the technologists was also very beneficial as they helped me group few features in the two different technologies which I would have missed if I was only working with the users. Following these sessions, I created a Dashboard map. -
-
Ideation
I did some quick sketches for the website and dashboard and did some initial user testing with paper prototypes. I made changes based on the feedback and created mid-fi wireframes and conducted user-testing with the users/participants of the programme. We collected great user feedback. Among numbers of interesting points, a very valuable one was to make the process of connecting the device more simple by omitting some steps . This was done by pre-selecting some features which usually users would have selected. It was important to show the features ( even if they were pre-selected) so that the user is familiarised with them and can use them freely when they become an advanced user.
-
-
Product Design
The project is based on two aspects
- 1. Informing the start-up companies about Things Connected programme, how it has helped companies in the past and where is the location of the current programme. This is done through the responsive website
- 2. During the programme help the people working in the start up build prototypes they can show the investors by introducing them to low powered network technologies like Lorawan and Sigfox. This is done through the dashboard
-
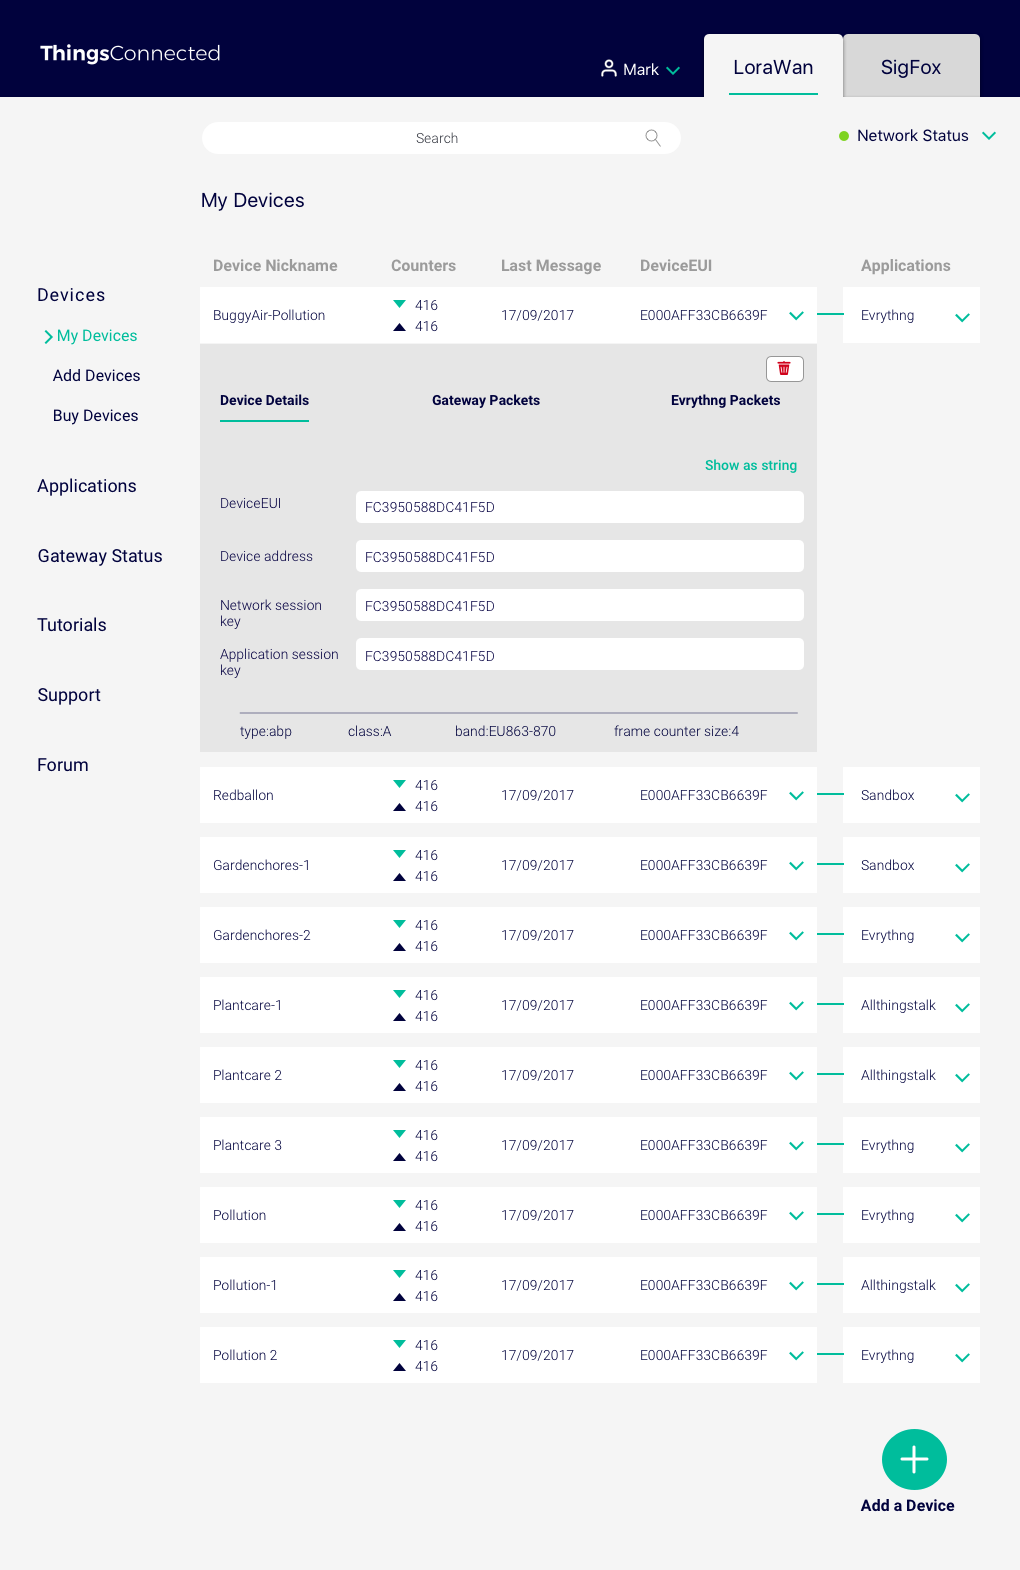
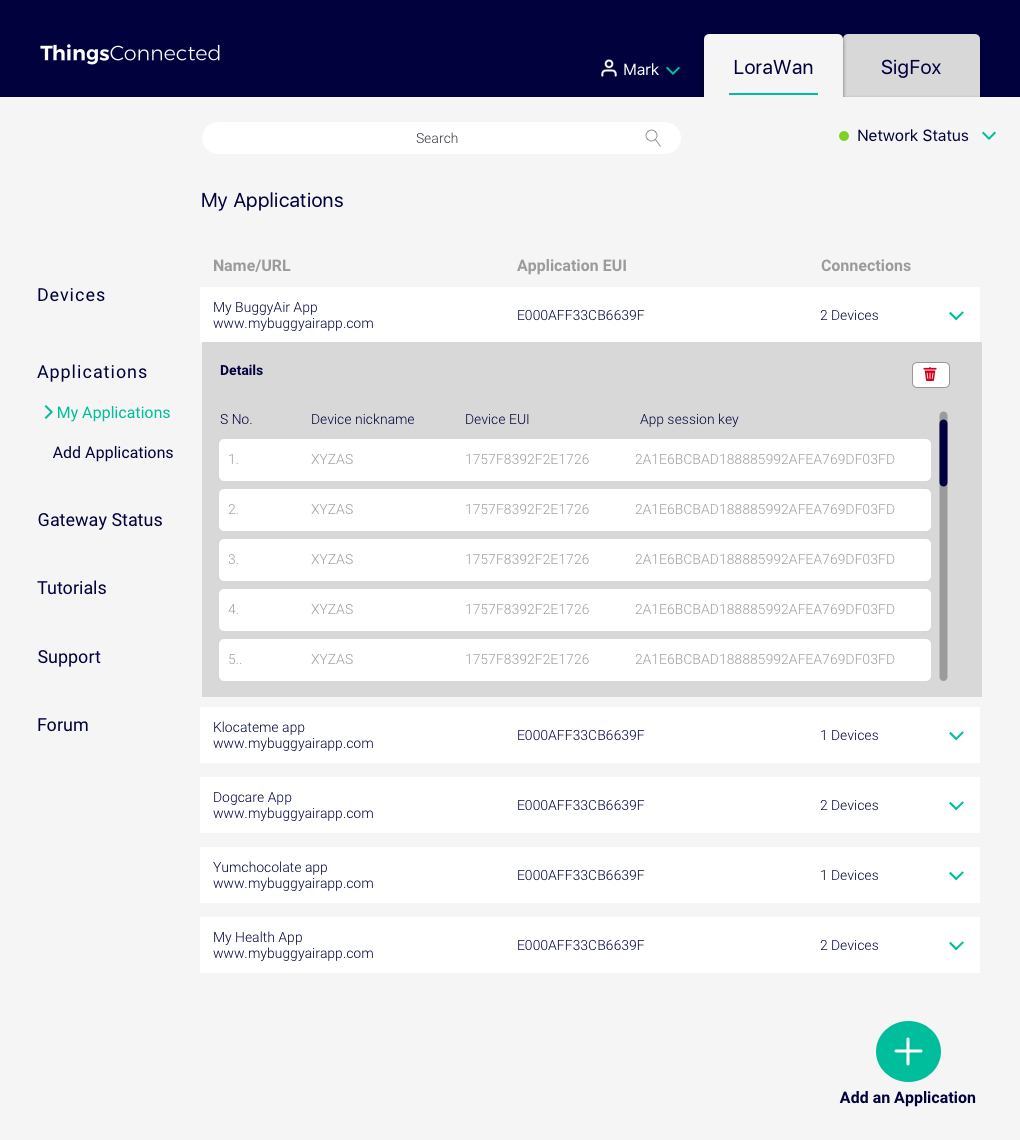
Dashboard
Here are some glimpses of few pages from the dashboard:
- 1. Tutorial page in Sigfox part of dashboard
- 2. Adding an application in SigFox
- 3. Adding a device in Lorawan
- 4. Adding an application in Lorawan
-
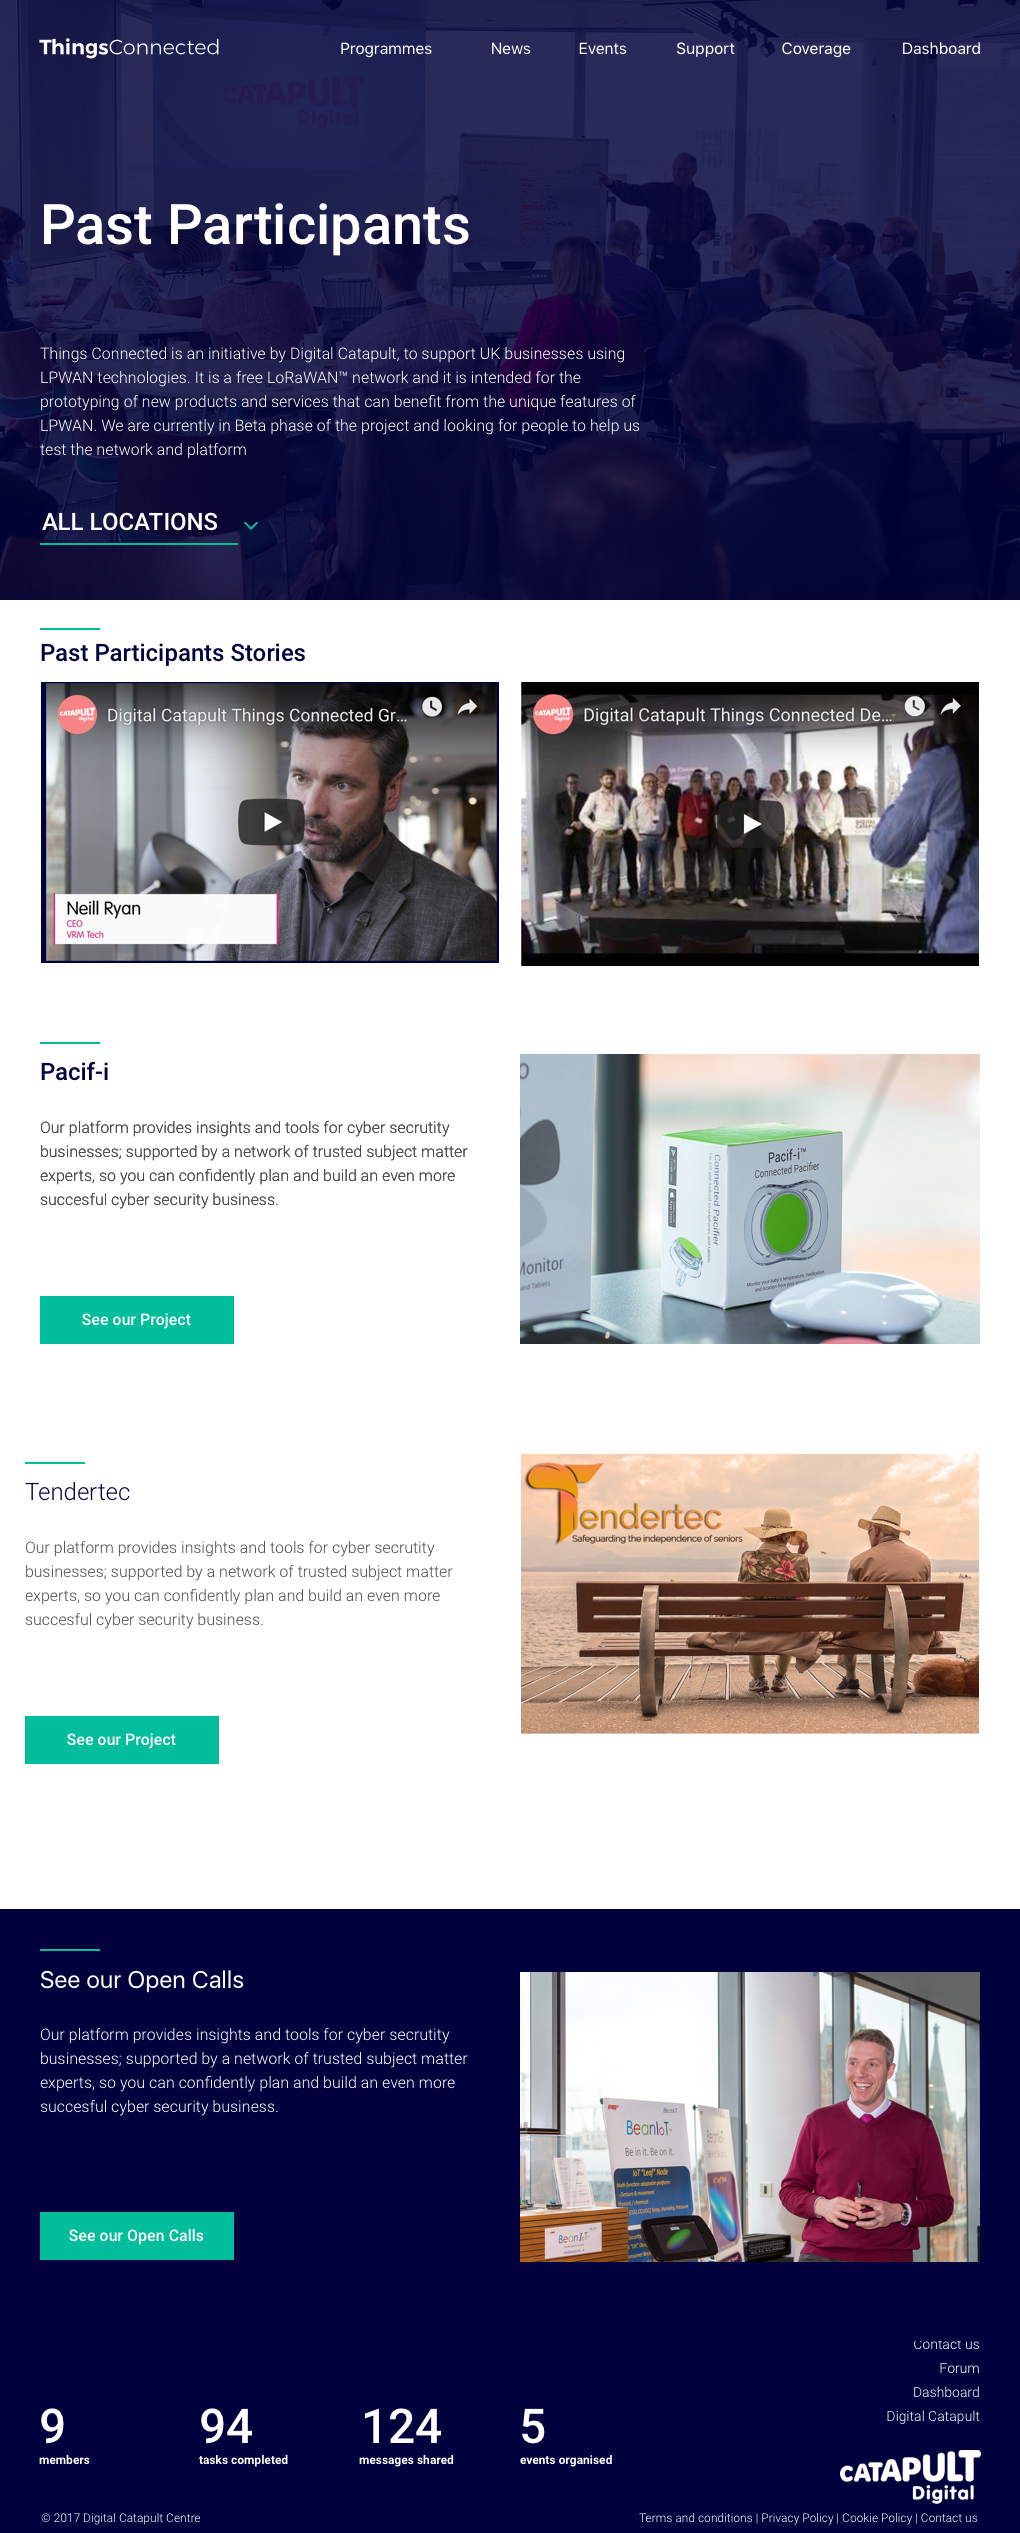
Desktop
Here are some glimpses of few pages from the website
- 1. Homepage
- 2. Past participants
- 3. Registration
-
Mobile
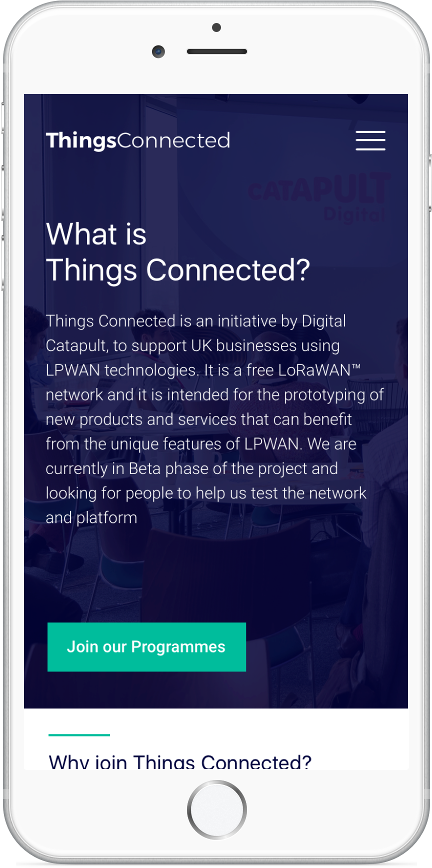
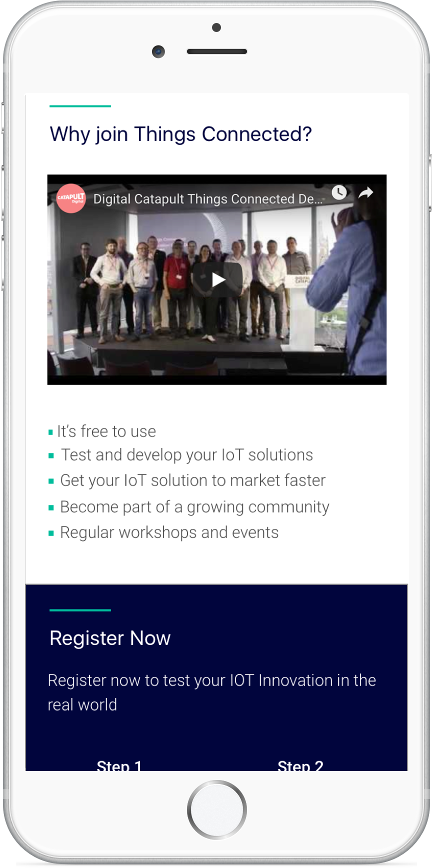
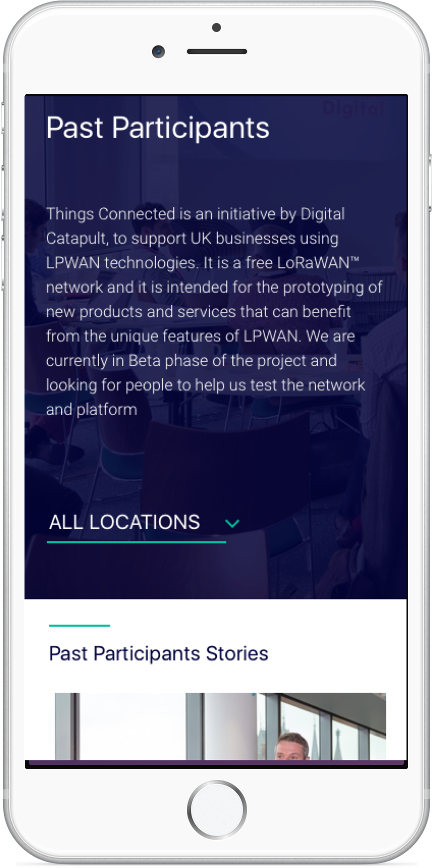
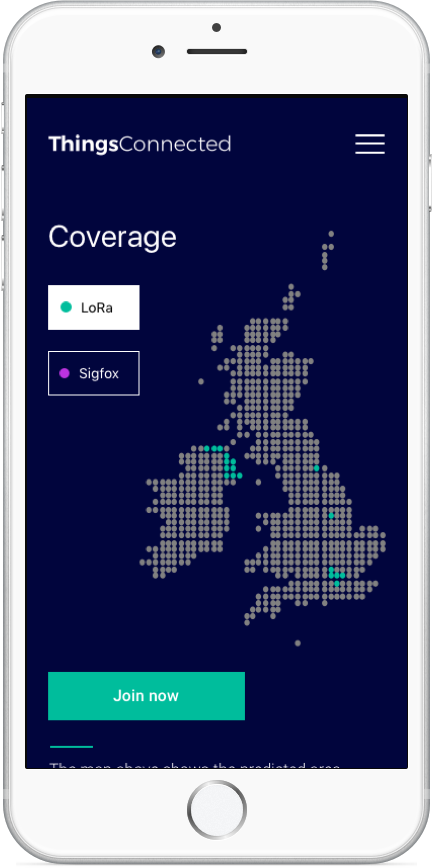
Below some screens designed for the mobile version of Things Connected:
- 1. Homepage
- 2. Past participants
- 3. Coverage page